Installation
Download and install EVAnalyzer on Linux, Windows, or macOS. Get started →

 Raw
Analyzed
Raw
Analyzed
EVAnalyzer is the next-generation successor to the original EVAnalyzer ImageJ plugin. Rebuilt for modern workflows, it pairs a high-performance image viewer with a fully configurable, multi-step analysis pipeline builder. While adaptable to any image format, EVAnalyzer is optimized for complex datasets, including fluorescence microscopy and high-content, whole-slide screening data. Designed for scale, the platform efficiently batch-processes thousands of images simultaneously, storing all results in a structured local database for seamless export and downstream analysis. See About for the full history.
Installation
Download and install EVAnalyzer on Linux, Windows, or macOS. Get started →
First Steps
Create your first project and run your first analysis. Learn more →
Commands
Browse the full library of 35 pipeline commands. Explore commands →
Tutorials
Step-by-step guides for spot counting, colocalization, and more. View tutorials →
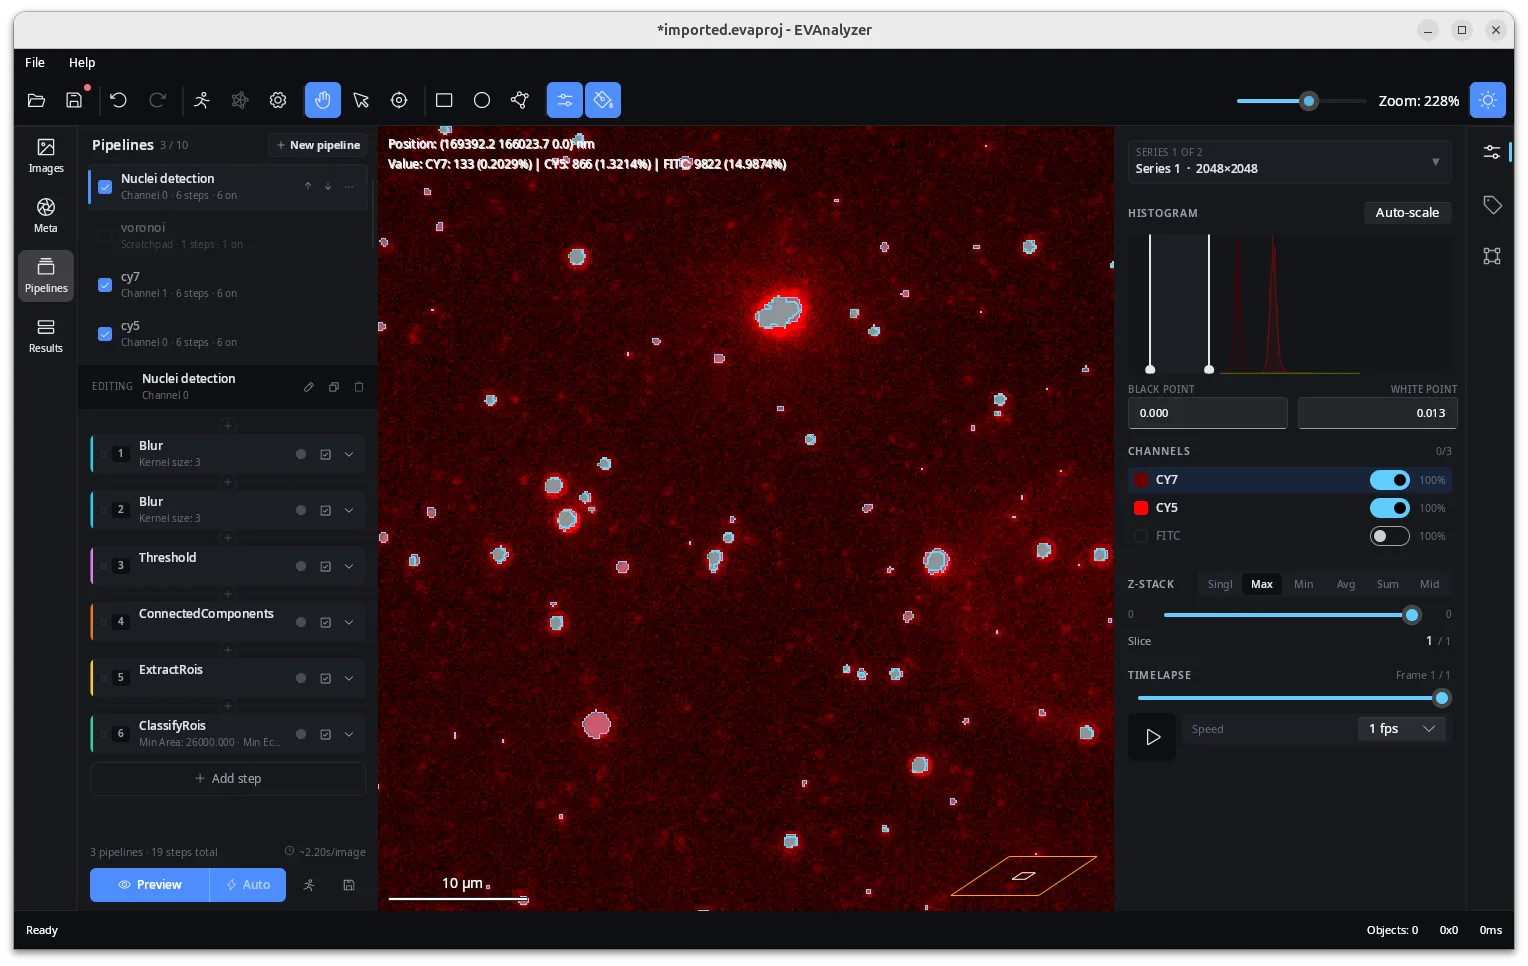
 LightDark
Configure multi-step pipelines and preview segmentation results live against your raw image data - in light or dark mode.
Multiple pipelines
Create as many independent image processing pipelines as your experiment needs - one per channel, or chained together for complex multi-step workflows.
40+ file formats
CZI, ND2, LIF, VSI, OME-TIFF, SLD, SCN, and more via Bio-Formats, with full multi-channel support out of the box.
Whole-slide image support
Large pyramidal, tiled whole-slide images are streamed and analysed tile by tile automatically - no manual downsampling required.
Cross-tile object merging
A whole organ or tissue region spanning hundreds of tiles on a gigapixel slide is reassembled into one correctly-measured object - not just stitched within a fixed overlap window like other tools. How it works →
Z-stacks & time-lapse
Intensity projections (Max, Min, Avg, Sum, Middle) or per-frame processing across Z-stacks and time-lapse (T-stack) sequences.
Live multi-channel viewer
Per-channel brightness/contrast, visibility toggles, and colour assignment, with a live pipeline preview that updates as you tune each step.
Interactive charts & results database
Histogram, scatter, and boxplot charts, plus a drillable plate/well heatmap, over results stored in a queryable local database, ready for grouping, filtering, and export to XLSX, CSV, or Parquet.
Batch processing at scale
Queue and process thousands of images unattended - the same pipeline runs consistently across an entire dataset, storing results as it goes.
Built in Rust
EVAnalyzer is written in Rust rather than Python, for native-code performance and memory safety across large batch runs.
Classical & AI segmentation
Combine classical algorithms (Threshold, Watershed, Edge Detection) with AI-based object detection (Stardist, UNet, Cellpose) in the same pipeline - or import a published bioimage.io model to auto-configure one.
Train your own AI classifiers
Paint examples directly on your images and train a Random Forest, k-NN, or neural-network pixel/object classifier in minutes - no external model or dataset required, ready to use as a pipeline step.